

CLIMATE CHANGE EMOTIONS · PROJECT FINDINGS
Research
How do we feel about climate change, how can we measure these emotions, and how do they relate to action? Explore six areas of our completed project — from conversations about personal experiences to studies of brain activity.
STAGE 01 / 06 · INTERVIEWS
How do we feel when we think about climate change?
Individual interviews in Poland and Norway
in-depth interviews
countries: Poland and Norway
scientific publications
We conducted in-depth interviews with 40 people in Poland and 33 in Norway who described themselves as highly concerned about climate change. We asked about the emotions the climate crisis evoked, its impact on their daily lives, and how they coped.
Their accounts revealed a wide range of sometimes conflicting feelings: sadness about losses, anger at inaction, anxiety about future generations, but also hope and a sense of community. These emotions shifted with circumstances, experiences, and the particular aspects of climate change people focused on.
The studies showed that the term “climate anxiety” alone does not capture this diversity. Understanding these experiences also requires attention to relationships and to the social and political context.
“In the past, I could sometimes push thoughts about climate change aside, but now that is virtually impossible.”
Excerpt from a participant’s account in the Polish study, quoted on the original project website. Translated from Polish for this page.
One changing climate. Many different experiences.
The interviews revealed four main themes: threats associated with climate change, the inevitability of its consequences, responsibility, and a sense of community or isolation in caring about the climate. Each theme was associated with a range of emotions.
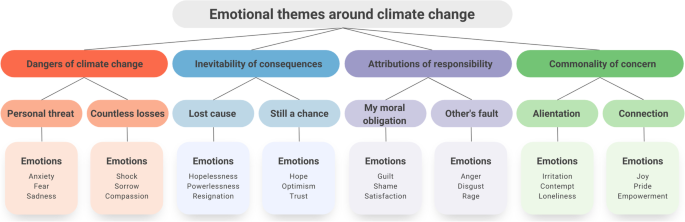
Original map of themes and emotions from the Polish study. Click the figure to view the publisher’s version.
Source: Zaremba et al., Current Psychology, Fig. 1. DOI: 10.1007/s12144-022-03807-3. Licensed under CC BY 4.0; figure unchanged.
Whose experiences do these findings describe? We interviewed people who were highly concerned about climate change. Their accounts illustrate the diversity of experiences within this group; they do not show how common particular emotions are in the wider population.
Read the full publications
Poland · Zaremba et al.
A wise person plants a tree a day before the end of the world: coping with the emotional experience of climate change in Poland
Current Psychology, 42, 27167–27185 (2023; first published online in 2022).
Norway · Marczak et al. (2023)
“When I say I’m depressed, it’s like anger.” An exploration of the emotional landscape of climate change concern in Norway and its psychological, social and political implications
Emotion, Space and Society, 46, 100939.
STAGE 02 / 06 · THE ECCS STIMULI SET
Stories that evoke climate emotions
How can we study climate emotions experimentally when everyone brings different experiences? We developed ECCS — a set of 180 short stories designed to evoke anger, anxiety, compassion, guilt and hope, alongside neutral stories.
Their content drew on real experiences described in interviews and a survey. Across three studies in Poland and Norway, we tested people’s responses to the stories: ratings were highly consistent, and greater concern about climate change was associated with stronger emotional responses.
The stories are available in Polish, Norwegian and English, allowing other researchers to use them in studies of climate communication, emotions and action.
180 stories
Short accounts of situations in which climate change takes on personal meaning.
3 validation studies
Ratings collected in Poland and Norway.
3 languages
Materials available in Polish, Norwegian and English.
Two example stories from ECCS
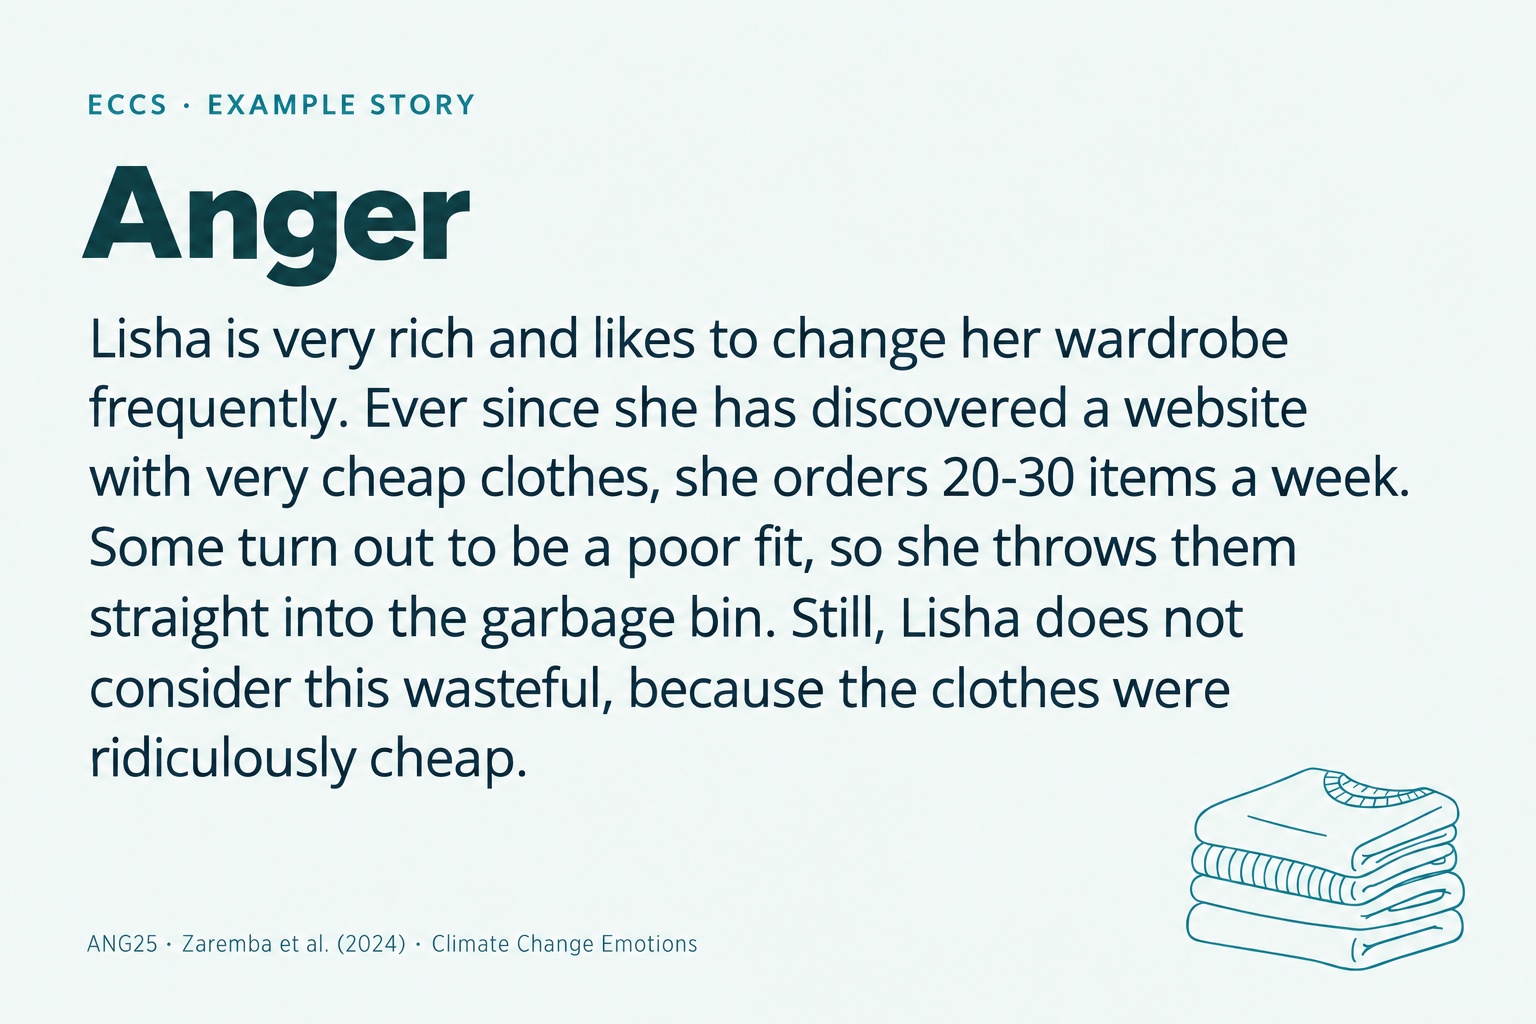
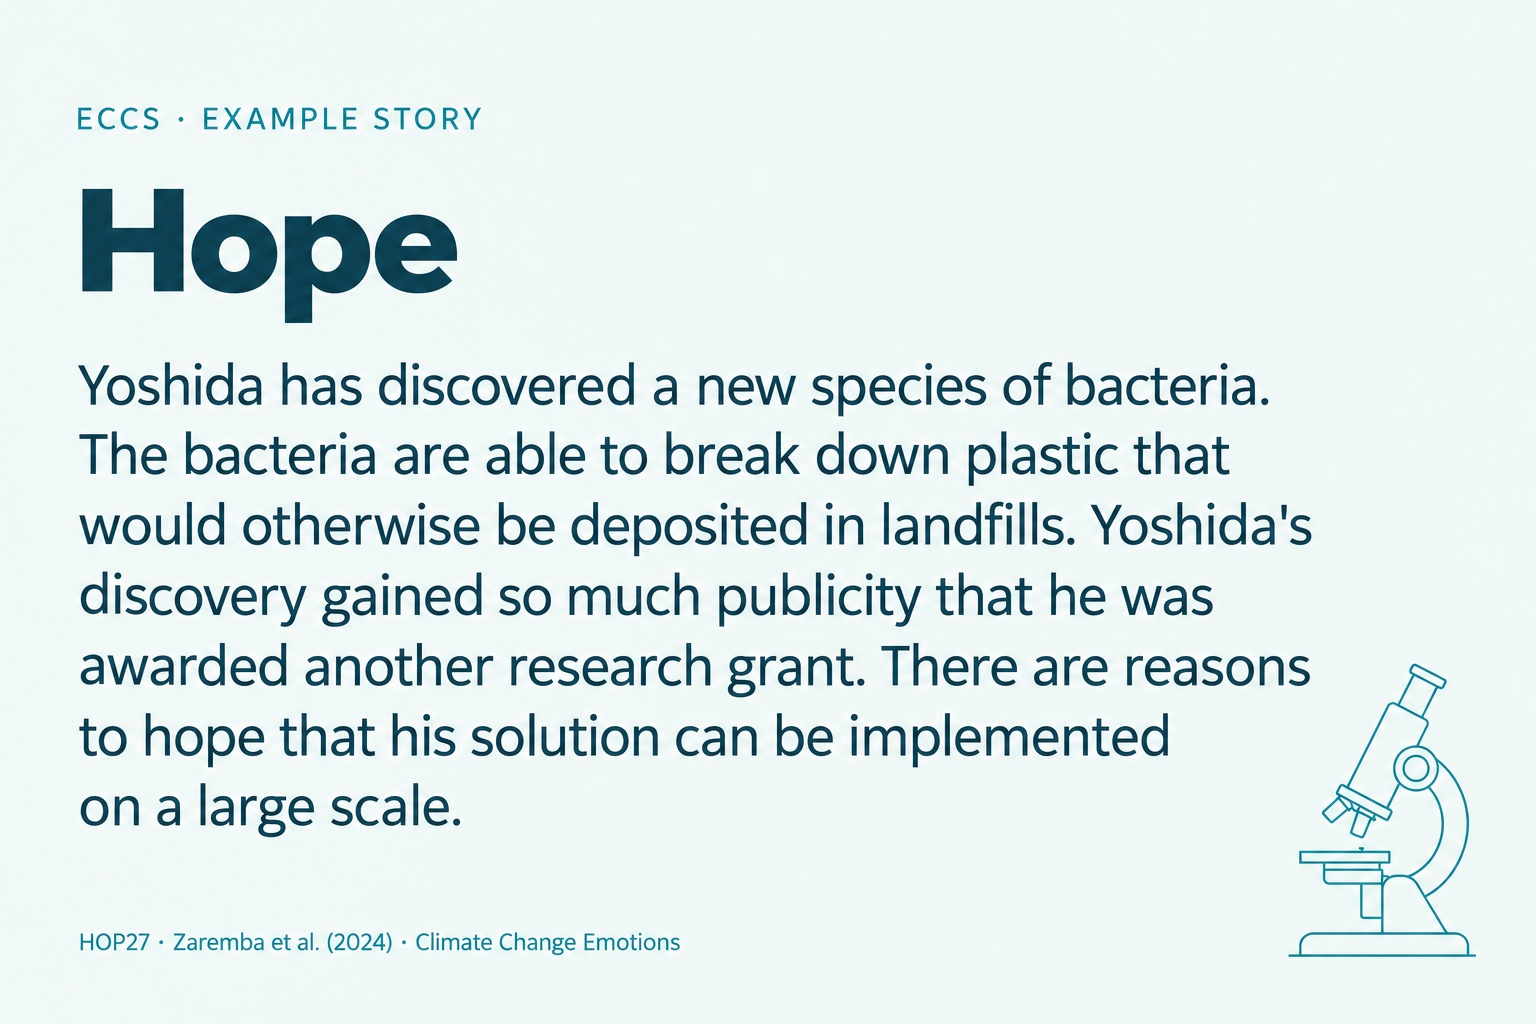
How do you respond to these stories? Below are two stories used in the study: one from the anger category and one from the hope category. Click a card to enlarge it.
Story source: Zaremba et al. (2024), Behavior Research Methods, ECCS stimuli set — ANG25 and HOP27. Read the publication.
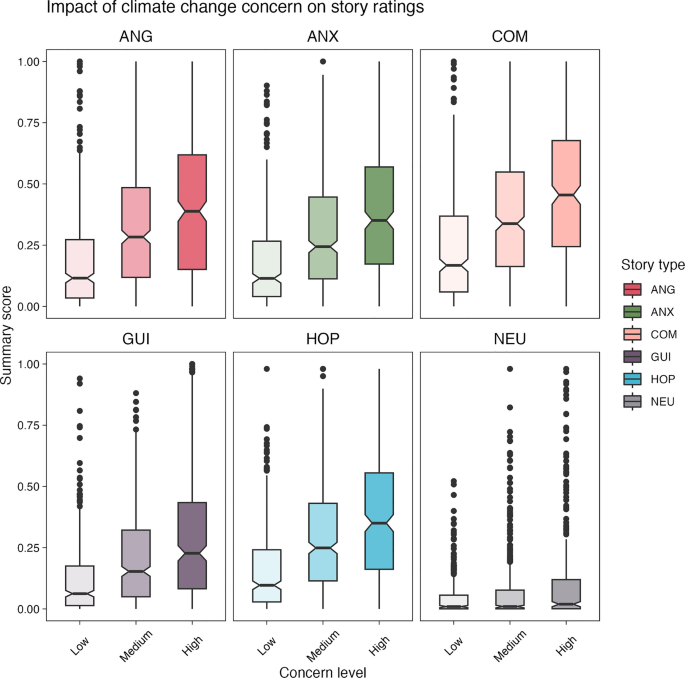
Why does the same story affect people differently?
People who were more concerned about climate change responded to the stories with stronger emotions. Colours indicate story categories; the horizontal axis shows climate change concern, and the vertical axis shows a composite measure of emotional response intensity. The graph shows an association between these variables, rather than evidence of causation.
Read the full publications:
Source: Zaremba et al. (2024), Behavior Research Methods, Fig. 3. Publication · CC BY 4.0. Original figure, unchanged.
STAGE 03 / 06 · THE ICE QUESTIONNAIRE
How can we measure climate emotions?
To better understand responses to climate change, we needed a tool that went beyond anxiety alone. We developed the Inventory of Climate Emotions (ICE) — a questionnaire measuring anger, contempt, enthusiasm, powerlessness, guilt, isolation, anxiety and sorrow.
Validation studies examined whether it could reliably measure these eight emotions, and its structure was subsequently confirmed in Norway and Ireland. Different emotions showed different relationships with perceptions of climate change, support for climate policies, and engagement in action.
ICE therefore makes it possible to study a broader picture of climate emotions and compare them across groups and countries.
Eight emotions — a broader picture of experience
The descriptions below explain the meaning of the scales. They are not quotations of questionnaire items.
Anger
Outrage towards people or institutions responsible for harming the climate.
Contempt
Weariness and aversion towards the topic of climate change.
Enthusiasm
Hope, inspiration and energy associated with solutions and collective action.
Powerlessness
A sense of limited influence and uncertainty about what one can do.
Guilt
Remorse about one’s own impact on the climate.
Isolation
A sense that others do not share one’s concern about the climate.
Anxiety
Worry about threats and the future in the context of climate change.
Sorrow
Sadness about losses and irreversible changes in the natural world.
From lived experiences to a research tool
1 · Understand
Interviews, a review of existing knowledge, and item development.
2 · Test
Expert review and questionnaire studies in Poland.
3 · Compare
Validation of the Norwegian and English versions in Norway and Ireland.
STAGE 04 / 06 · BEHAVIOURAL EXPERIMENT
Do emotions translate into action?
Does evoking anger, compassion or hope encourage people to take more action for the climate? We tested this in an experiment involving 1,029 people in Poland and 1,010 in Norway, with hypotheses and an analysis plan registered before the study began.
Participants read emotional or neutral stories, then had opportunities to complete an effortful task supporting environmental protection and donate money to climate action. Contrary to our predictions, we detected no effect of the emotional condition on effort or donation amounts.
Under these experimental conditions, a brief emotional message was not enough to increase these forms of engagement. Appealing to emotions alone does not guarantee a change in behaviour.
How did the study work?
1 · Assignment
Random assignment to one of four conditions: anger, compassion, hope, or a neutral state.
2 · Stories
Reading nine stories and rating one’s emotions.
3 · Action
An effortful task and a decision about donating part of one’s payment to WWF.
Two ways to measure engagement
Effort and time
Participants could complete up to 15 tasks. Correct answers increased the donation made by the researchers.
Personal money
Participants decided how much of their own payment to donate to WWF.
Key finding: we did not detect the expected increase in engagement after emotional stories. This conclusion applies to this experiment and these forms of action; it does not mean that emotions never matter.
Read the full publications:
STAGE 05 / 06 · NEUROIMAGING · CLIMATE BRAIN
Climate emotions and decisions in the brain
How can we study what happens in the brain when we experience climate emotions and make decisions about the environment? In a study involving 160 adults, we used functional magnetic resonance imaging (fMRI), which provides an indirect measure of changes in brain activity.
Participants read stories intended to evoke anger or hope, or neutral stories, and made decisions involving financial rewards and reductions in CO₂ emissions. We combined brain images with task and questionnaire data to create the CLIMATE BRAIN dataset, describing its methods and data quality in a scientific publication.
By sharing this resource, we have enabled other researchers to further investigate the mechanisms underlying climate emotions and climate-related decisions.
Bringing together emotions, decisions and brain imaging
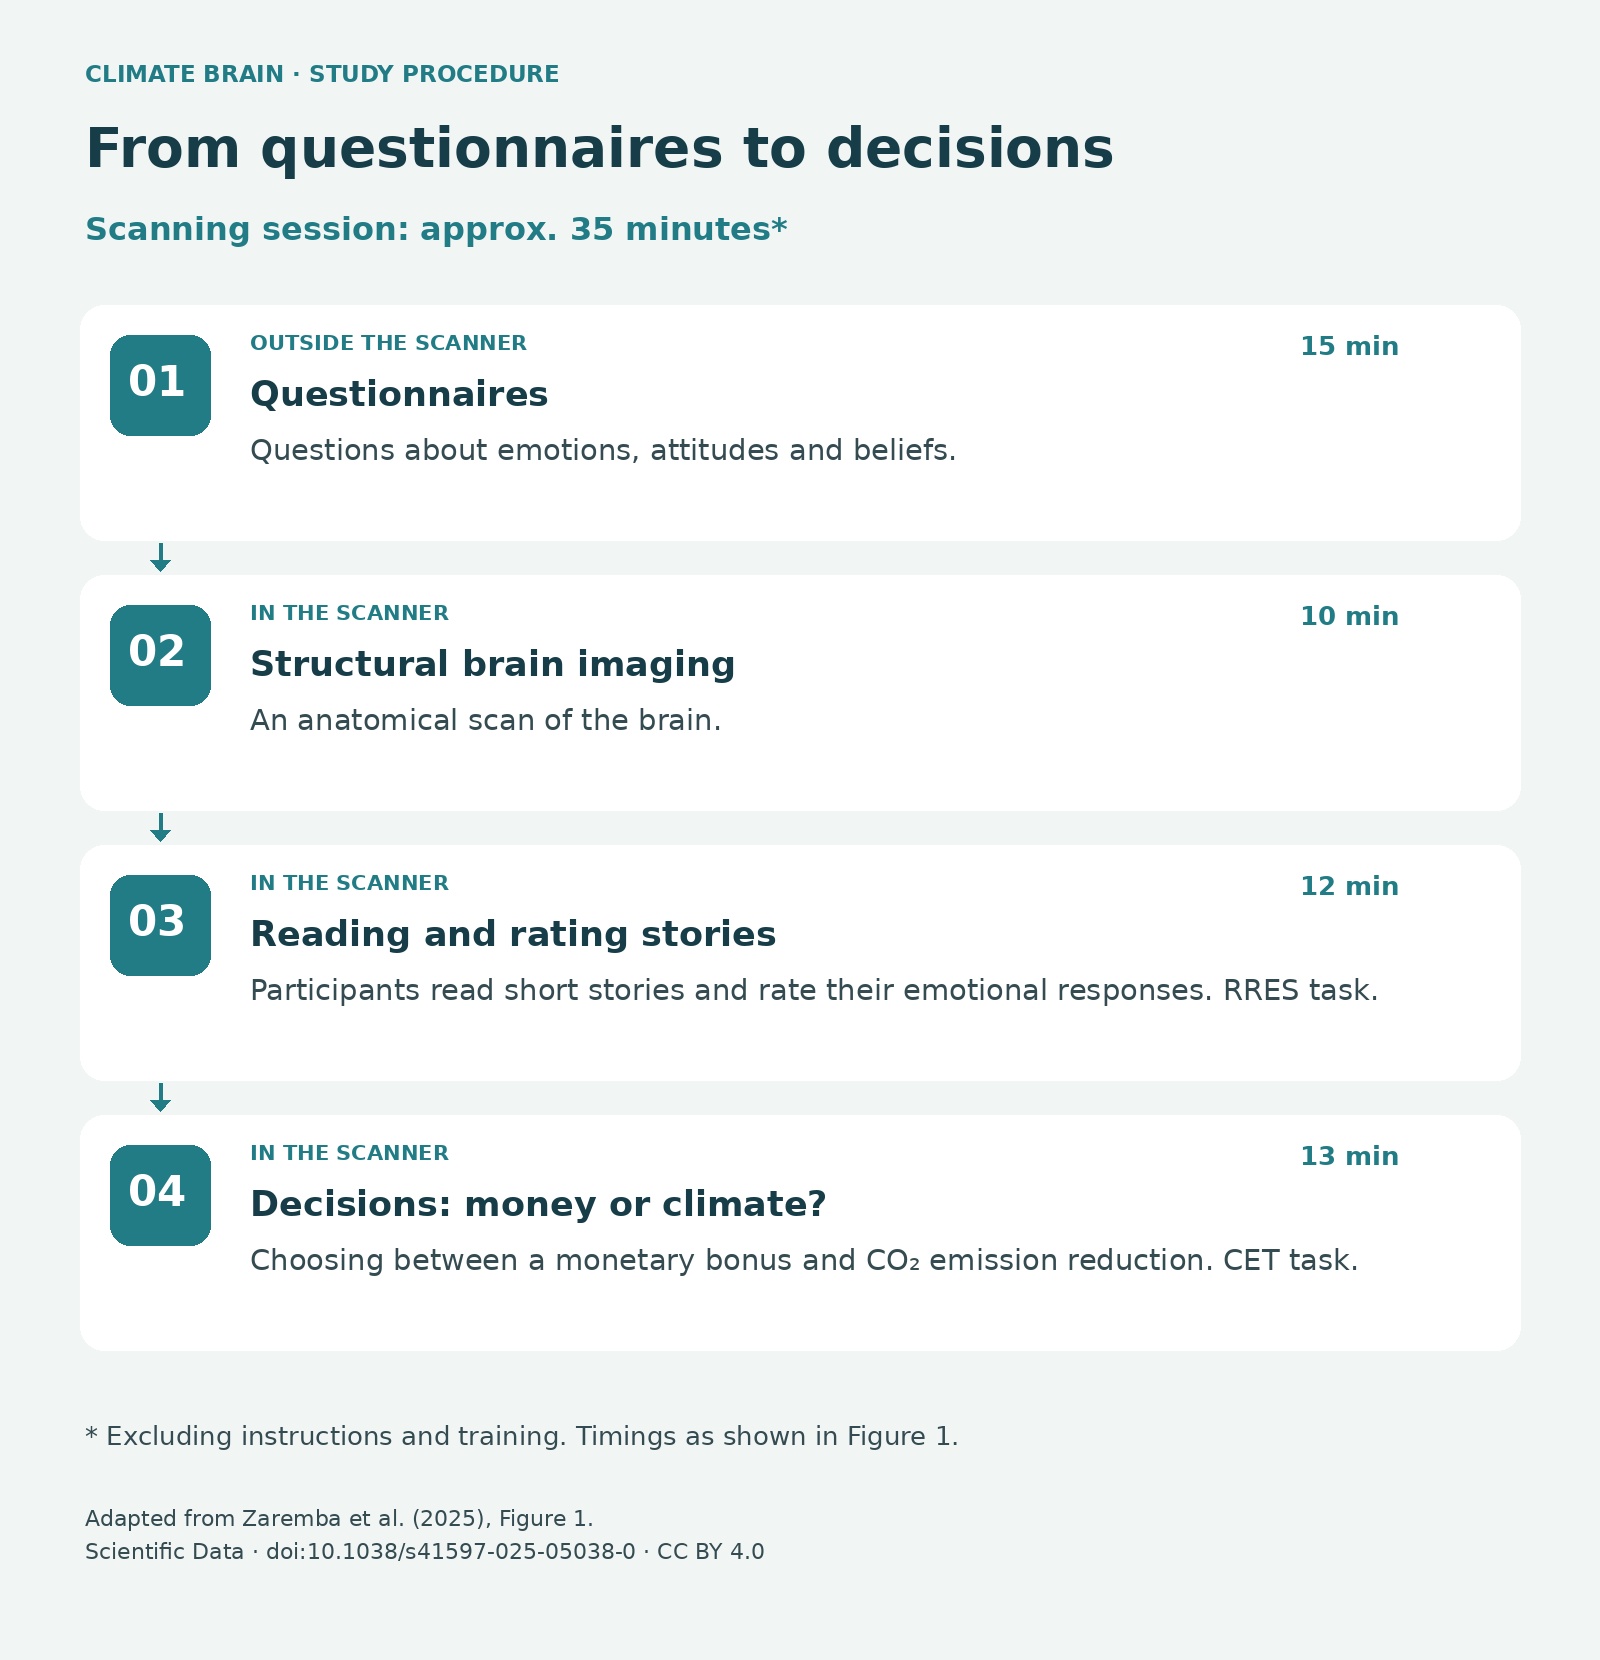
The scanning session lasted approximately 50 minutes, including instructions and training. Adapted from Figure 1 in the publication (CC BY 4.0). Click the diagram to enlarge it.
The scanner used in our study
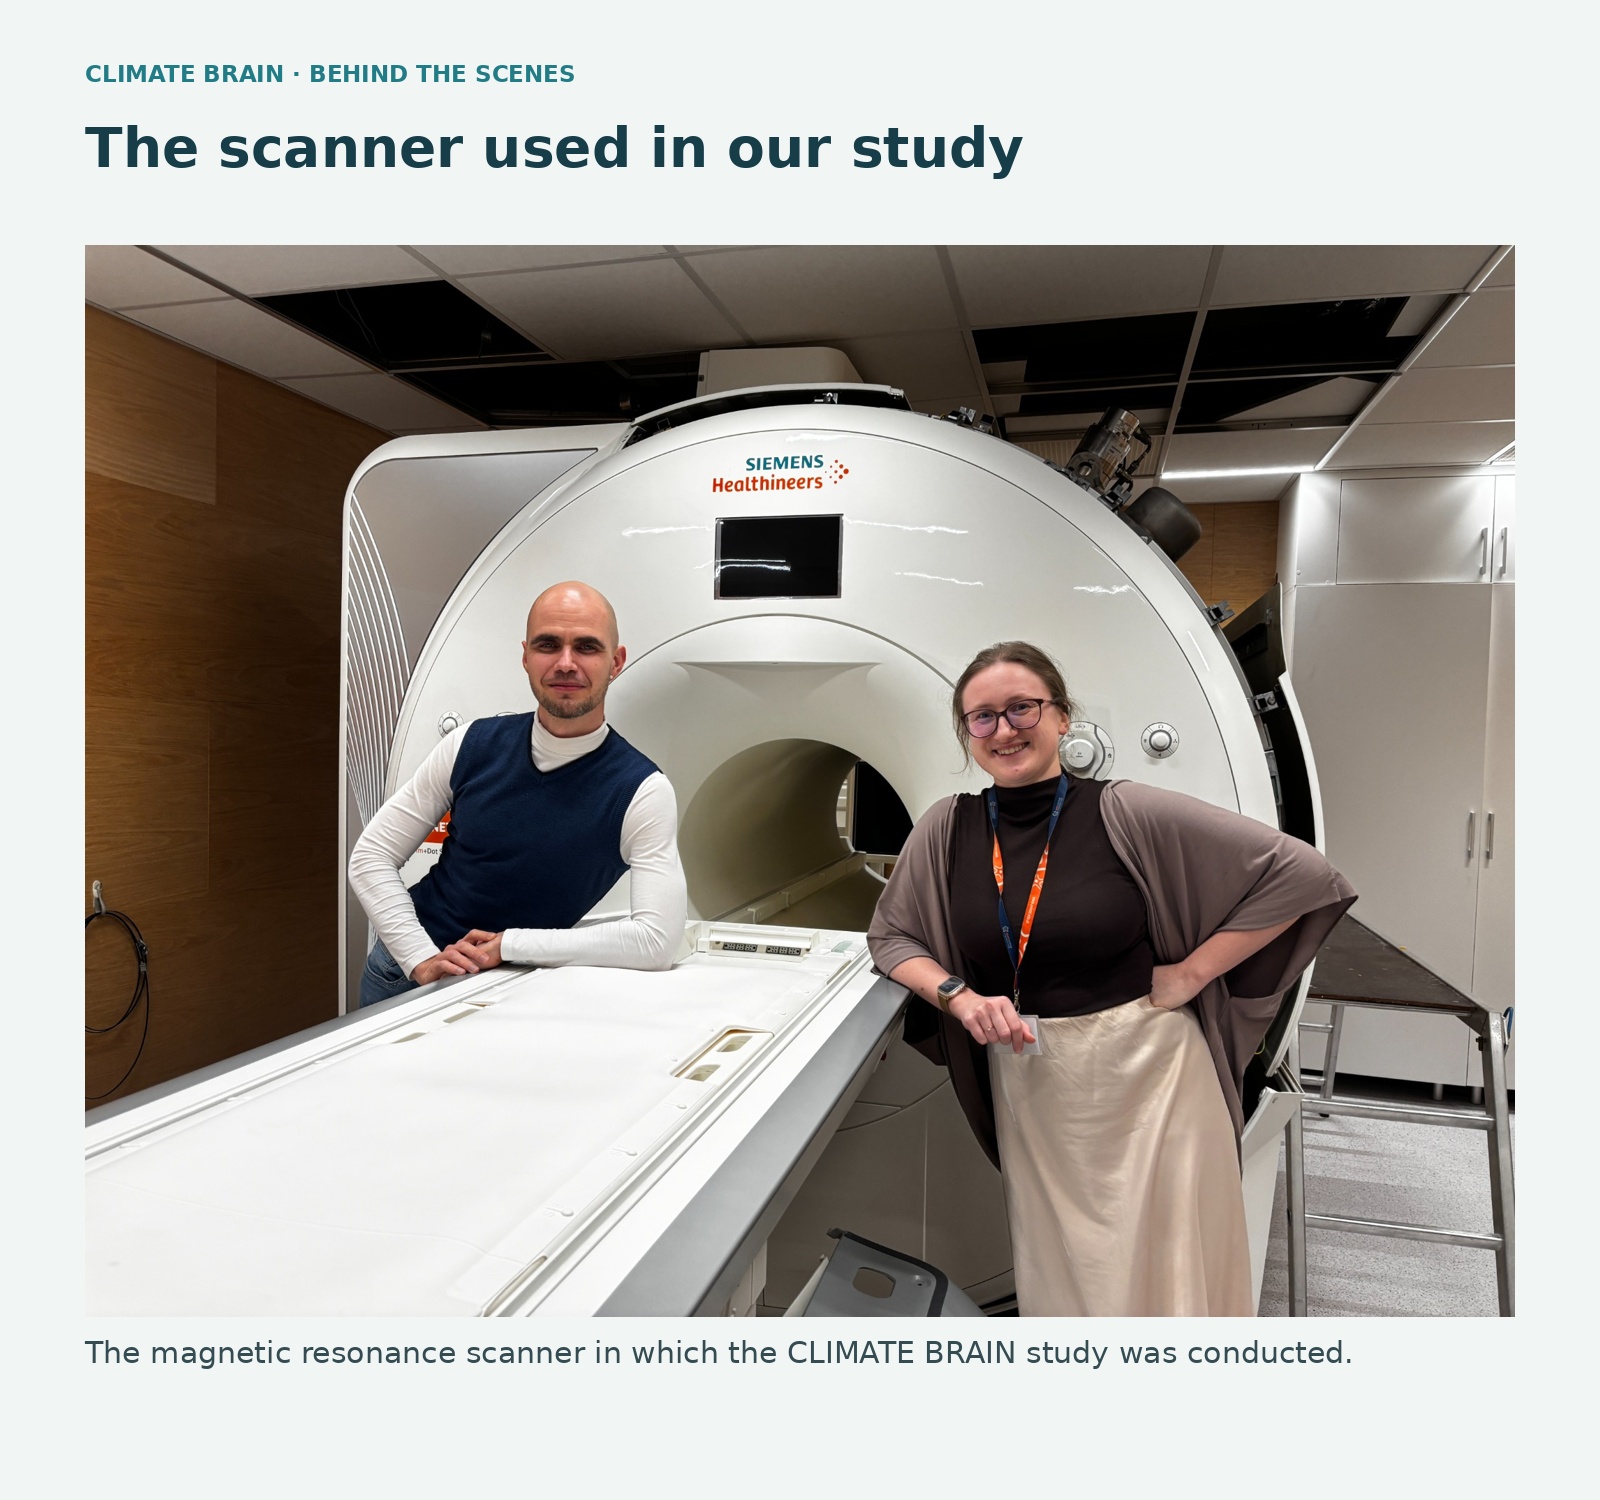
The magnetic resonance scanner in which the CLIMATE BRAIN study was conducted.
The brain during decision-making
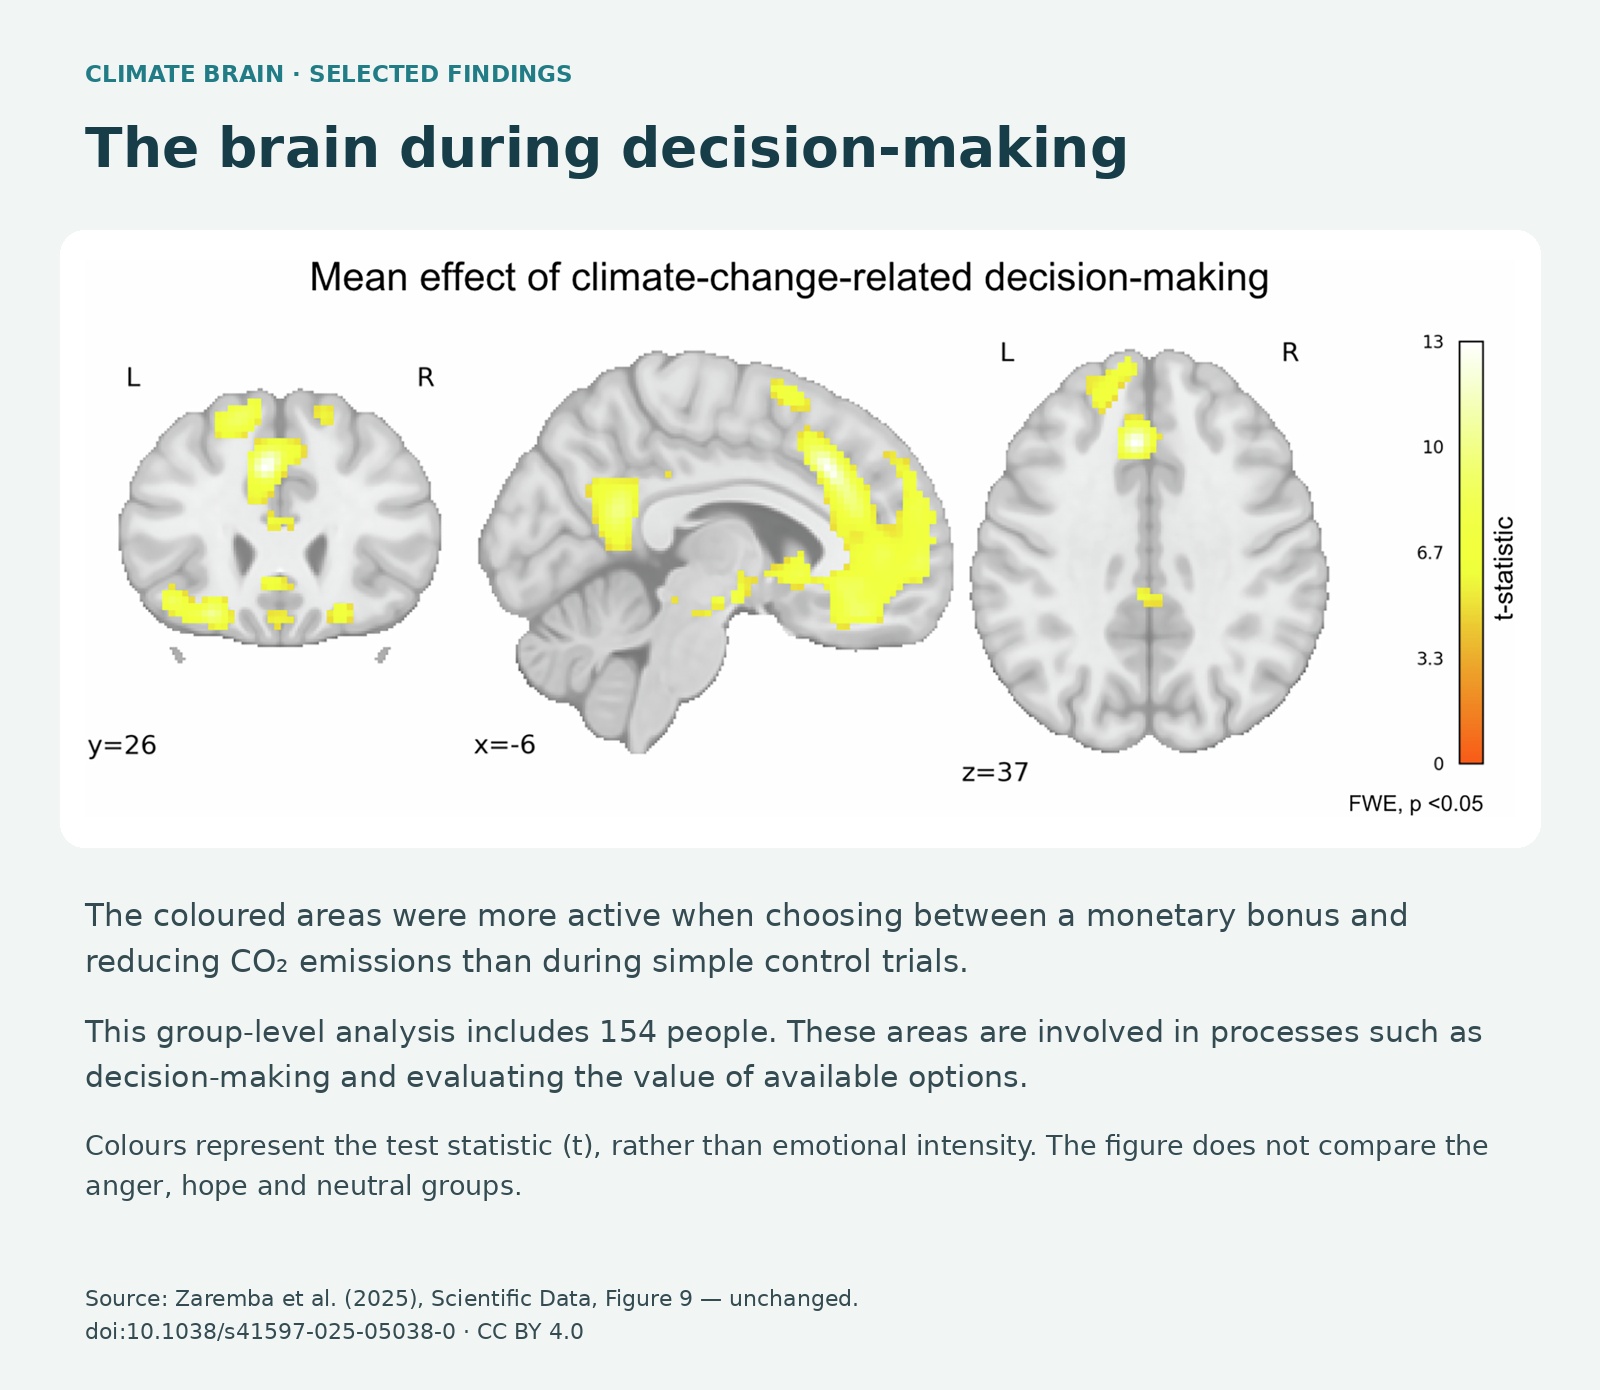
The coloured areas were more active when participants chose between a monetary bonus and reducing CO₂ emissions than during simple control trials. This is a group-level analysis of 154 people. These areas are involved in processes including decision-making and evaluating the value of available options.
Colours represent the test statistic (t), rather than emotional intensity. The figure does not compare the anger, hope and neutral groups.
Source: Zaremba et al. (2025), Scientific Data, Fig. 9. Original figure with an English explanatory caption. CC BY 4.0.
Read the full publications:
STAGE 06 / 06 · BODILY MAPS OF EMOTIONS · emBODY
Where do we feel emotions in the body?
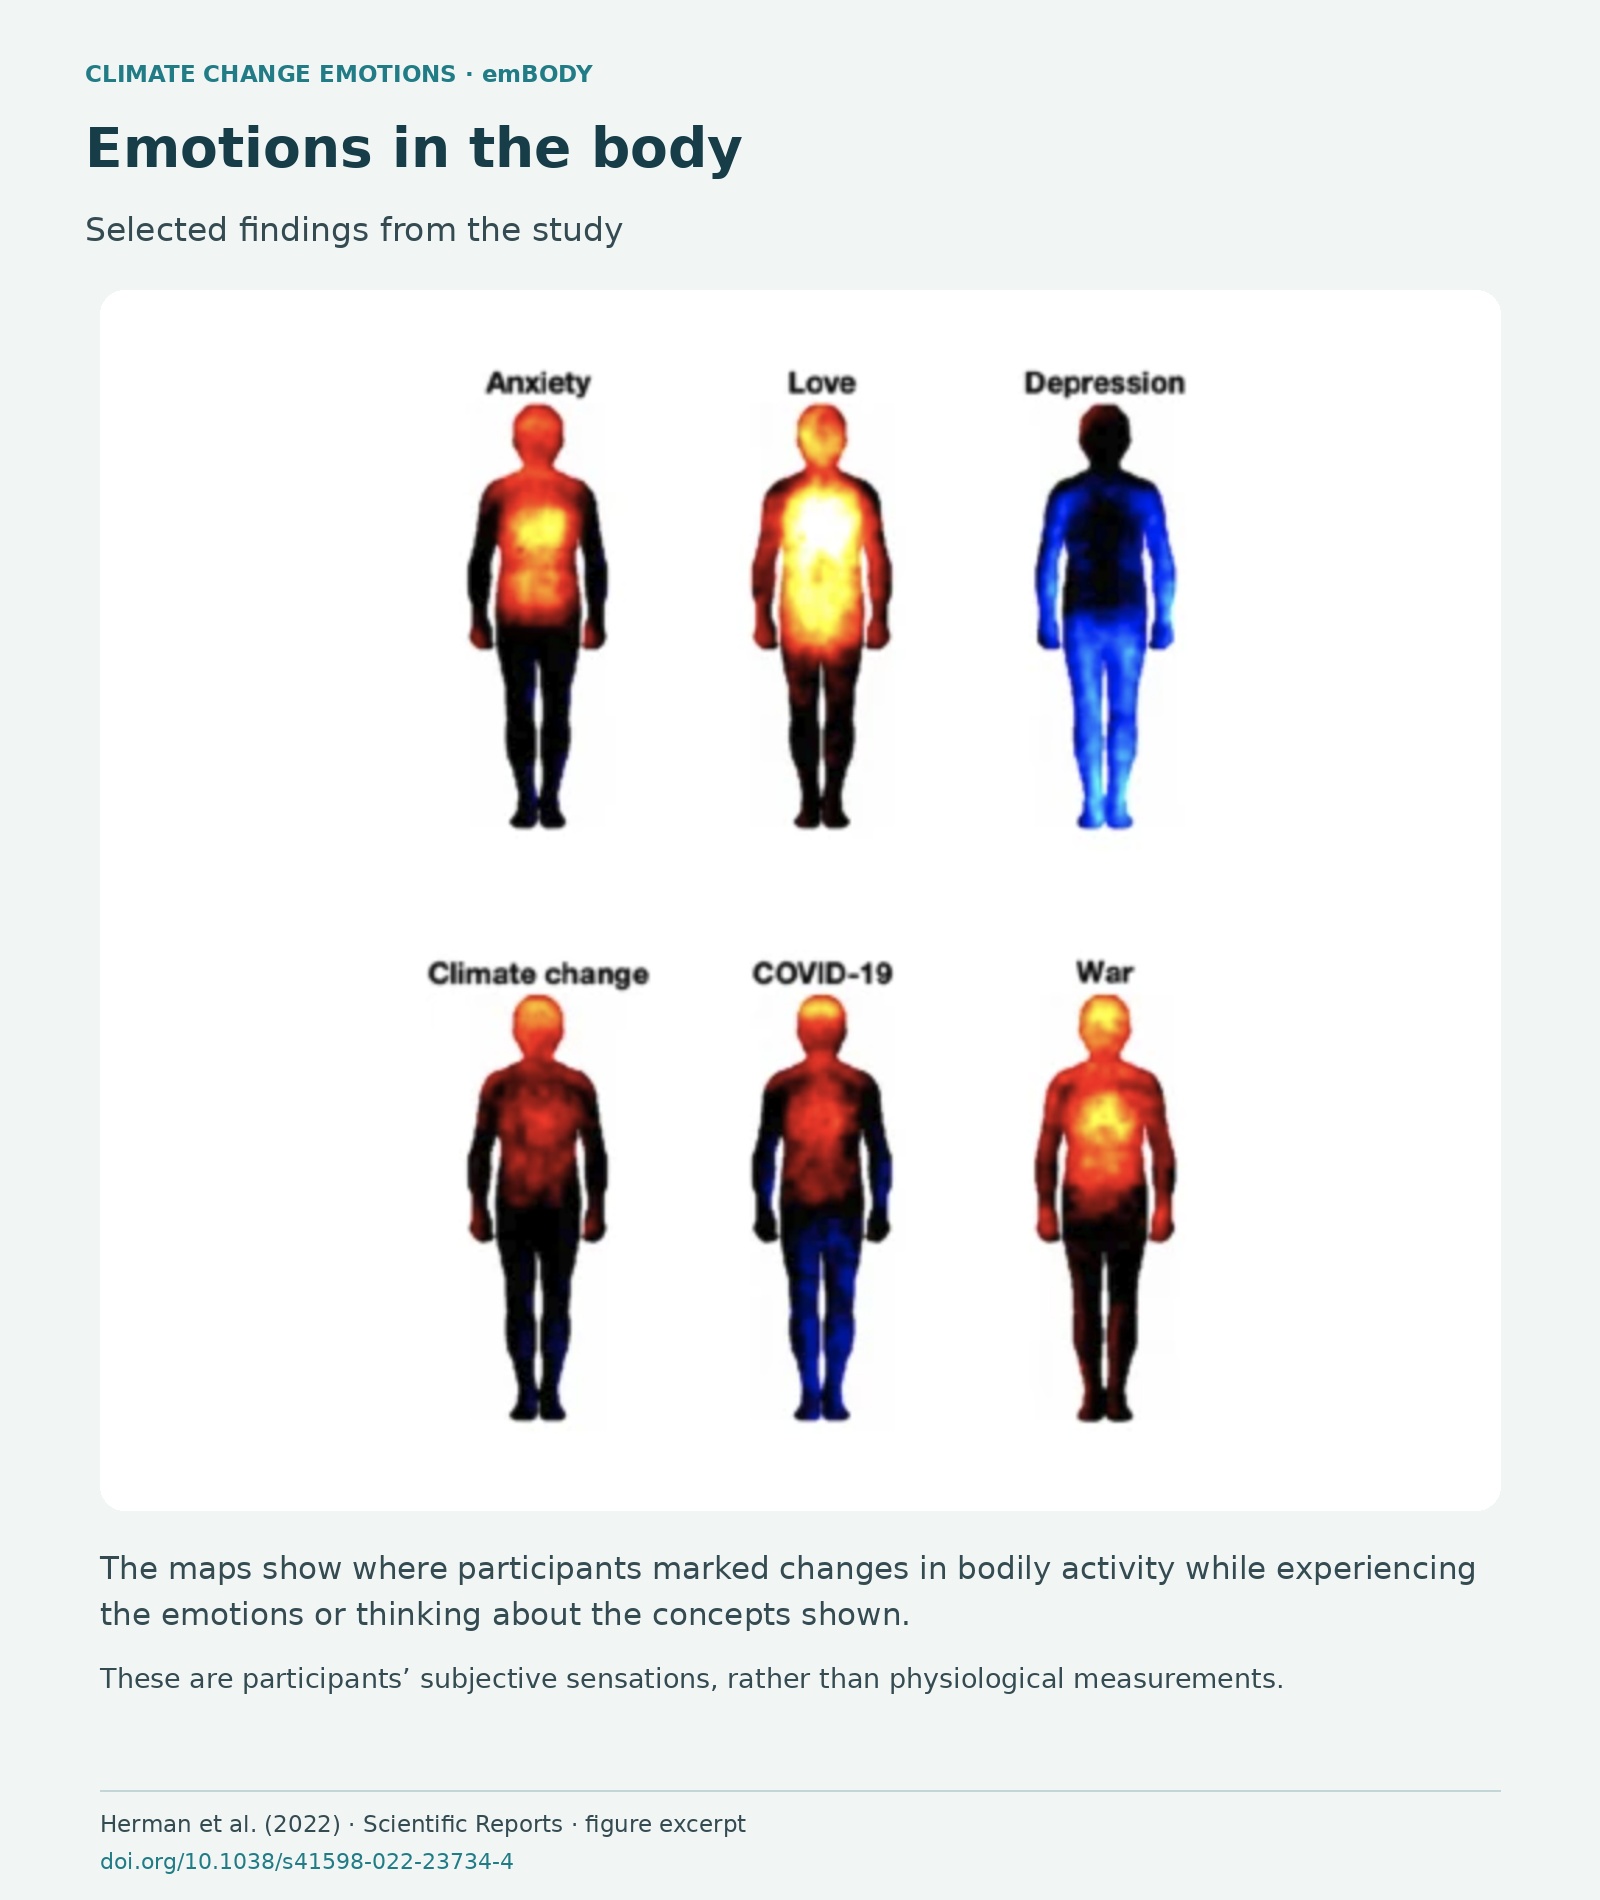
We describe emotions in words, but we can also indicate where we feel them in the body. Using the emBODY tool, we analysed responses from 548 people who marked areas of increased or decreased bodily activity while experiencing emotions and thinking about different phenomena, including climate change.
The maps differed across phenomena, with thoughts about climate change associated with sensations in areas including the head, chest and abdomen. Comparisons with maps of specific emotions suggested that responses to complex issues may involve a range of feelings.
This method complements questionnaires by capturing the bodily dimension of experience. The maps represent participants’ subjective sensations, rather than direct physiological measurements.
How is a bodily map created?
1 · An emotion or phenomenon
The participant sees the name of an emotion or phenomenon, such as climate change.
2 · Two body outlines
On one outline, they mark increased bodily activity; on the other, decreased activity.
3 · A group map
Responses from many people are combined and analysed to describe patterns of bodily sensations.
Selected findings from the study: the maps show where participants marked changes in bodily activity while experiencing the emotions or thinking about the concepts shown. These are subjective sensations, rather than physiological measurements.
Source: Herman et al. (2022), Scientific Reports, figure excerpt. Read the full article.
How should you read the maps? Warm colours indicate reported increases in bodily activity, and cool colours indicate decreases. A group map does not prescribe what each individual should feel.
Selected findings: emotions in the body
Read the full publications: